
Project Summary Panel
- The main purpose of the project summary panel is to provide a quick overview
of a project’s financial performance. - You can also have a more in-depth look into the project. Filtering and sorting will enable the panel to be personalised for a selection of projects.
- The panel offers the ability to select the calculations used for both the current and forecast profit and loss figures, along with the ability to hide/display columns.

Filter Options
- Within the Panel, there are a series of filtering options available. Click on the
 icon to expand the selection. This brings up the following set of filtering options to allow you to manipulate the project summary report.

- The default option is to display project “Status”, “Branch” and “Discipline”.
- Current Month - Sets whether the current months ‘Actuals’ should be taken
from the Current Month or the previous month. - Division, Project Runner and Project Director are all standard Project fields.
- Project Role works in conjunction with “Project Staff”. Selecting a role, which lists all the roles specified within the Internal team tab, then pre-filters the “Project Staff” list based on the selected option:

- Client - populated with the project clients.
- QA Gateway - display a list of QA Gateways and only displays projects that have the selected gateway as the current gateway.
- After changing a filter options, the refresh icon
 MUST be clicked to confirm the filter and return a new set of results.
- The searches are remembered and next time a user logs on, the filters should be set the same.
*Please note: All amounts are shown in the project currency.
Project Summary Links
- The panel also has functionality to review parts of a project without leaving the home dashboard screen. From left to right, the buttons allow you to view the performance summary of a project, the performance graphs of a projects, and lastly, view projects in a billing family or where cross-charging is taking place:

- By clicking the
 icon, an additional window will bring up the Performance Summary Screen.

- By clicking the
 icon, an additional window will bring up the Performance Graph Screen. This graph is covered in further detail in a later stage of this document.

- By clicking the
 icon, you can see an overview of related projects or billing family projects. This will contain a subtotal the group of projects selected.

Order Available Columns
The below list summarises the columns available to include in the Project Summary panel:
| Name | Description | ||||||||||||||||||||
| Project Number | N/A | ||||||||||||||||||||
| Project Name | N/A | ||||||||||||||||||||
| Client | N/A | ||||||||||||||||||||
| Status | The project status | ||||||||||||||||||||
| Gateway | The current QA gateways. | ||||||||||||||||||||
| Accounts Company | The accounts company that this project belongs to | ||||||||||||||||||||
| Currency | The currency which this project operates in. All amounts are displayed in project currency. | ||||||||||||||||||||
| Fee | The total Workstage fees. | ||||||||||||||||||||
| Fee – Sub Consultants | Fee minus sub consultant costs (including recharge) and sub consultant remaining budget (including recharge). | ||||||||||||||||||||
| Invoiced | Total fee invoiced to date. NB this is affected by the current month filter (Use Forecast or Use Actuals). | ||||||||||||||||||||
| Aged Debt | Aged debt includes all outstanding invoices. If any invoices are over 30 days, the value is highlighted in red. Please note that all amounts are NET. | ||||||||||||||||||||
| Target Budget | The target budget, based on the profit margin set in the fee / Workstage’s page. | ||||||||||||||||||||
| Total Cost | Total cost of labour, plus non rechargeable expenses, and sub-consultants. | ||||||||||||||||||||
| Total Cost including Recharge | Total cost of labour, plus all expenses and sub-consultants including rechargeable. | ||||||||||||||||||||
| Profit / Loss Current |
| ||||||||||||||||||||
| Profit % | Current Profit / Loss percentage. This is colour coded as green, yellow, or red based on the default target margin (e.g., 15%).
| ||||||||||||||||||||
| P/L Forecast |
| ||||||||||||||||||||
| Forecast Profit % |
| ||||||||||||||||||||
| Percent Complete | % Complete is a single value summarised by project from the most recent Workstage estimated % complete column in the WIP page. The project % complete figure is weighted by Workstage fee. Example:
If no fees are set for the project, the figure is an average of the values from the WIP page. | ||||||||||||||||||||
| Last Update | The most recent month that entries were made for the project in the WIP panel. |
Configurable Options
As you can see from the list highlighted above, there are lots of columns for you to choose from. It is up to yourselves to review and select the key columns that will be displayed to their users on the home page.
Project Summary Formatting:
- Hide columns
- Add columns
- Re-align the spacing of columns
- Re-ordering of columns
Calculation of Current Profit/Loss
| Option 1 (Default) | Option 2 | Option 3 |
| Using Invoices to date | Using Fees Earned to date (by estimated % complete) | Use Fees Earned to date (By labour plan) |
| Actual Billing - Actual Costs | (Total fee* Est % Complete) –Actual Costs | (Total Fee * (Actual Costs / (Actual Costs to date + Forecast Costs from date)) – Actual Costs |
Calculation of Forecast Profit/Loss
| Option 1 (Default) | Option 2 |
| Using estimated % Complete | Using Forecast Cost Plans |
| Total Fee - (Actual Costs/Est % Complete) | Total Fee – (Actual Costs to date + Forecast Costs from date) |
Project Metrics
- The Project Metrics Panel allows you to see how productively and efficiently the project is being run. As will be shown later in this document, the user will only be able to see the metrics that they have been given security permissions to review.

- Please note that this figure matches the new column in the Project Summary panel, including the selected current month option (Use Actuals, or Use Forecast). Hovering your mouse cursor over each tile on the metrics panel will give a description of how the figure is calculated.
- Options for showing or hiding certain metrics based on project roles are detailed in the security section of this document. There is also the option of re-ordering the metrics to suit your needs, again please contact support for help in configuring this.
Available Project Metrics
The following metrics are currently available on Rapport3:
| Name | Description |
| Billing Plan (Fee) | The amount in the billing plan for the current month - non rechargeable. |
| Invoiced (Fee) | The amount invoiced in the current month. Includes fees only. Please note that all amounts are NET. |
| Billing Plan (All) | The amount in the billing plan for the current month, including rechargeable amounts. |
| Invoiced (All) | The amount invoiced in the current month (including recharged income). Please note that all amounts are NET. |
| Total Invoiced | The total fee invoiced to date. |
| Aged Debt | The current outstanding debt for the project. Please note that all amounts are net of tax. |
| Target Budget | The target budget, based on the profit margin set in the fee / Workstage’s page. |
| Total Cost | The total cost to date (excluding rechargeable). Green = Total Cost less than target budget. Amber = Total Cost less than total fee. Red = Total Cost greater than total fee. |
| Cost (inc. rech.) | The total cost to date (including rechargeable). |
| % Complete | The estimated percentage complete of the project, based on the WIP Estimated % Complete values. A single project percentage is calculated, weighted by Workstage fee. |
| Labour Progress | Shows the actual labour progress against planned based on Estimated % Complete. Calculation = (Total Budget labour days x % complete) – Actual labour days |
| P/L Current | The current Profit / Loss of the project, corresponding to the value in the Project Summary panel. |
| P/L Current % | The current Profit / Loss % of the project, corresponding to the value in the Project Summary panel. |
| P/L Forecast | The forecast Profit / Loss of the project, corresponding to the value in the Project Summary panel. |
| P/L Forecast % | The forecast Profit / Loss % of the project, corresponding to the value in the Project Summary panel. |
| Budget Labour Days | The total number of budget labour days for the whole life of the project. |
| Forecast Labour Days | The number of forecast days up to and including the current month |
| Actual Labour Days | The actual number of processed timesheet days up to and including the current month |
| Act. vs For. Days | Actual days minus forecast days up to and including the current month. A positive number means more days have been worked than the budget. A negative number means the actual days are within budget. |
| Gateway Status | The current QA gateway status |
Project Performance Graph
- To access the Performance Summary Graph, go to the Performance Summary Panel on the Home screen. Click the
 icon and this will load the below screen:

The various lines show cumulative figures of a project.
It can indicate the state of the project in several ways such as:
- Are our costs (the red line) exceeding our maximum (target budget) or what we had planned in for people, sub-consultants and expenses (green line)?
- Are our costs (the red line) so low that it is likely that we have not started work to the degree we had planned (green line)?
- Are our invoices (yellow bars) going out as planned and reaching the level of our forecast (yellow line)?
- Is what we had planned regarding costs (green line) in excess of our target budget or the intended fee (blue line)?
- Where will our costs end up (red dotted line) based around how far the project is thought to have gone?
Trace Definitions

- Auto Fee Profile - is the fee you intended to bill your client for (not including any recharges) set on the project (Projects, Fee/budget plan, Workstage’s, Workstage fees beak down). The fee is spread out as per the dates of the Workstage’s (Projects, Fee/budget plan, Workstage’s, Workstage Dates and Durations).

- Budget Profile - is what you have planned to spend. So, it includes amounts on the Labour, Expenses and Subconsultants plans (Projects, Fee/budget plan, Workstage’s, Labour plan/Expenses /Subconsultants plan). You can choose to include subconsultant recharges if you wish via the include sub-consultants’ option at the top of the screen (i.e., you can see the project if or if not those costs were recoverable or not).

- The Target Budget - shows the maximum amount of budget you intended to make. Each Workstage has set against it a target project margin (Projects, Fee/budget plan, Workstage’s, Workstage fees beak down) so if it were 20% for all Workstage’s you would be able to spend 80% of the fee before it cut into your intended margin. The Target budget represents this spread out over the Workstage timelines (Projects, Fee/budget plan, Workstage’s, Workstage Dates and Durations).

- Total Actual Costs - is the costs that the project has actually incurred i.e., based on Timesheet entries, Expenses, Purchase invoices. You can remove recharges sub- consultants amounts via the include subconsultants option at the top of the screen.

- Total Projected Costs - is the predicted spend on the project. It is based upon the WIP% figure manually entered in the system by the project runner to reflect how far each work stage has gone (Projects, Fee/budget plan, WIP).

- Billing Profile - is what has been planned to be billed on a month-by-month basis (Projects, Fee/budget plan, Billing plan).

- Billing Actuals - Shows the sales invoices.
Security Settings
- Due to the sensitive nature of the information the project analysis panels can show security on the Project summary and project metric panels is granular.
- Security can be controlled in a couple of ways for the panels, you can give certain security groups of staff full access to all the metrics panel and the project summary panel and all the data they are able to display.
- The other option is to restrict certain metrics to selected groups of staff based on their role on a project and restrict the projects that show and the columns in the project summary panel to staff who have defined roles on projects.
- For example, you could restrict some of the financial columns on the summary panel to just be visible to directors, in addition you can setup the security so they can limit the list to just projects where they are the Project Director.
Managing Security
- To manage the security of each panel on the dashboards, start by selecting the security console key:

- Then access the panel admin option from either the Home screen or Projects > Overview tab.

- Next, you need to let security groups have access to the actual data inside the panels. If you want to let the admin group see everything there is a security option you can obtain from the key on the Home tab, and the projects tab. There is a special permission called 'view all' against both the project summary panel and the project metrics panel.

- This will allow anyone in that group to access all the project summary information and all the project metrics on any project, so please proceed with caution.
- The project summary panel also has additional security options where you can restrict who can click on the performance summary, performance graph, and actual figures to get a more detailed drilldown. This is controlled in the control panel under Projects > Graph Trace admin, and the access to the drilldown data is controlled at the project tab security key.

- For the project metrics we would not recommend the 'view all' approach, we believe it is better to go through and review each metric and decide if its applicable for your practice and how you work.
- Access to control the metrics and who can view them are done through Control Panel > Projects > Dashboard > Project Metrics.
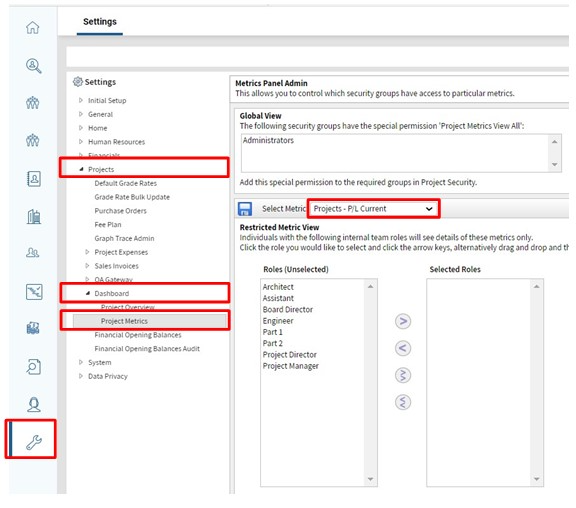
- In this screen, you can select each metric, and choose which project role will allow a staff member to be able to see a particular metric. This approach works best if you actively use the internal team section on a project.
Configuration Settings
Please contact the Cubic Interactive Support desk to update any of the configurable items. The Security settings are managed by your Rapport3 Super User.
- As highlighted above the following items can be configured configurable Items:
- Format of the Project Summary panels – columns can be removed/added/realigned.
- Calculation of the current Profit/Loss
- Calculation of forecast Profit/Loss